Comprehensive Technical Analysis for Quant (QNT)
As of 02/12/2024 01:12:57
Executive Summary
Based on the latest technical indicators, the current recommendation for Quant (QNT) is: Hold Off.
This analysis synthesizes multiple technical indicators to provide a well-rounded perspective on the asset’s potential movements.
Technical Indicators Overview
1. Price Analysis
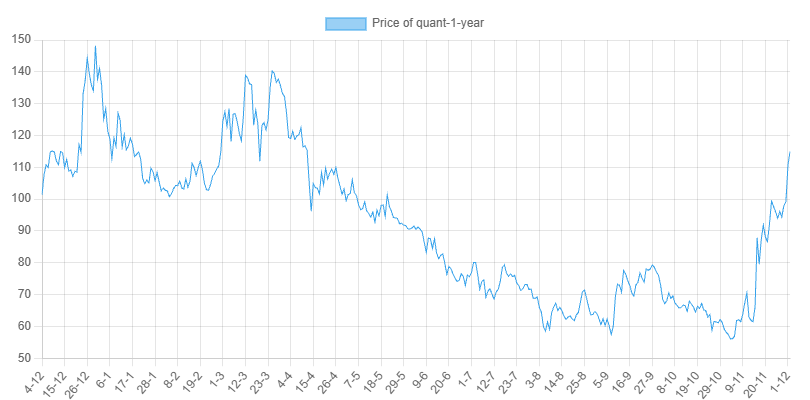
- Latest Close Price: $114.94
- Support Level: $54.4855197639,90.7799357637
- Resistance Level: $115.0014660186,115.0014660186
2. Relative Strength Index (RSI)
The RSI measures the speed and change of price movements. Values above 70 indicate overbought conditions, while values below 30 suggest oversold conditions.
- RSI (7-period): 83.43
- RSI (30-period): 69.19
3. Stochastic RSI
Stochastic RSI is a momentum oscillator that applies the Stochastic oscillator formula to RSI values, making it more sensitive to price changes.
- StochRSI %K (7-period): 89.71
- StochRSI %K (30-period): 97.46
4. Moving Averages (SMA)
Simple Moving Averages (SMA): Simple Moving Averages smooth out price data to help identify trends over specific periods.
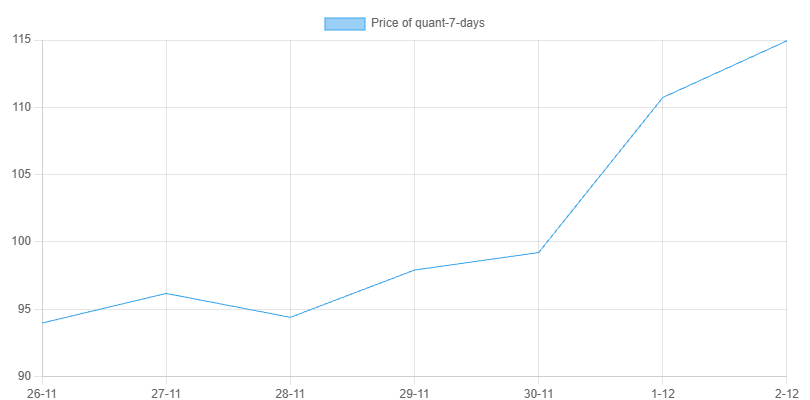
- SMA (7-period): 101.05
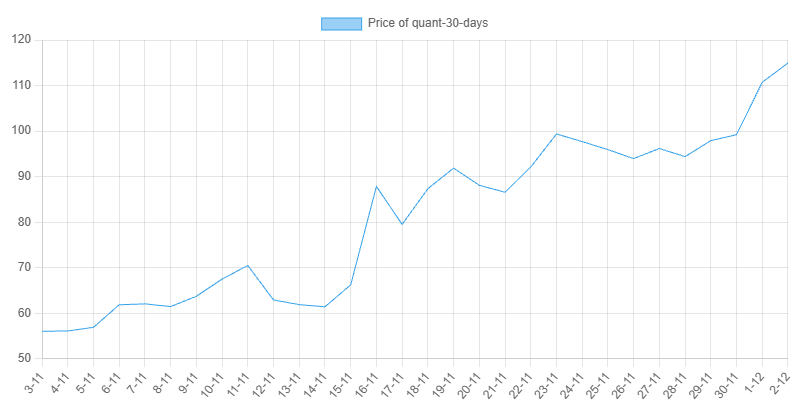
- SMA (30-period): 80.76
- Trend Analysis: The short-term trend is bullish as the 7-period SMA is above the 30-period SMA.
5. Average True Range (ATR)
ATR measures market volatility by decomposing the entire range of an asset price for a given period.
- ATR (7-period): 8.43
- ATR (30-period): 6.29
6. Moving Average Convergence Divergence (MACD)
MACD is a trend-following momentum indicator that shows the relationship between two moving averages of a security’s price.
- MACD (7-period): MACD: 10.09, Signal: 8.46
- MACD (30-period): MACD: 10.09, Signal: 8.46
7. Average Directional Index (ADX)
ADX measures the strength of a trend. Values above 25 indicate a strong trend, while values below suggest a weak trend.
- ADX (7-period): ADX: 67.19, +DI: 41.03, -DI: 4.26
- ADX (30-period): ADX: 28.33, +DI: 34.52, -DI: 9.64
8. Rate of Change (ROC)
ROC is a momentum oscillator that measures the percentage change in price between the current price and the price a certain number of periods ago.
- ROC (7-period): 19.82%
- ROC (30-period): 100.03%
9. Risk-Reward Ratio
The risk-reward ratio assesses the potential reward of a trade against its potential risk.
- Risk-Reward Ratio (7-period): 0.00
- Risk-Reward Ratio (30-period): 0.00
10. Bullish Candlestick Patterns
Bullish candlestick patterns can indicate potential upward price movements.
- 7-period Patterns: No bullish patterns identified.
- 30-period Patterns: No bullish patterns identified.
11. Volume Analysis
Trading volume indicates the strength of a price move. High volume during price increases suggests strong buying interest.
- Yesterdays Volume: 66005309.06
Price Charts
Price Over the Last Year
Price Over the Last Month
Price Over the Last 7 Days
Detailed Indicator Analysis
Relative Strength Index (RSI)
The RSI is currently at 83.43 (7-period) and 69.19 (30-period).
Overbought conditions.
Stochastic RSI
The Stochastic RSI %K is at 89.71 (7-period) and 97.46 (30-period).
Overbought.
Moving Averages (SMA)
The 7-period SMA is N/A, and the 30-period SMA is N/A.
Short-term trend is bearish.
Average True Range (ATR)
ATR values are 8.43 (7-period) and 6.29 (30-period), indicating the current market volatility.
High volatility.
Moving Average Convergence Divergence (MACD)
MACD readings are as follows:
- 7-period: MACD: 10.09, Signal: 8.46
- 30-period: MACD: 10.09, Signal: 8.46
Bullish momentum
Average Directional Index (ADX)
ADX values are [object Object] (7-period) and [object Object] (30-period).
A weak or no trend.
Rate of Change (ROC)
ROC values are 19.82% (7-period) and 100.03% (30-period).
Positive momentum.
Risk-Reward Ratio
The current risk-reward ratios are 0.00 (7-period) and 0.00 (30-period).
Unfavorable.
Bullish Candlestick Patterns
Detected bullish patterns in the last 7 periods: No bullish patterns identified.
Detected bullish patterns in the last 30 periods: No bullish patterns identified.
Volume Analysis
The yesterdays trading volume is 66005309.06.
High trading volume indicates strong interest.
Final Recommendation
Recommendation: Hold Off
This recommendation is based on a combination of multiple technical indicators:
- RSI and Stochastic RSI levels indicate potential overbought or oversold conditions.
- MACD trends suggest bullish or bearish momentum.
- ADX values confirm the strength of the current trend.
- ROC provides insight into the momentum direction.
- Risk-Reward Ratios assess the potential profitability versus risk.
- Bullish candlestick patterns highlight potential reversal points.
- Volume analysis indicates the strength of price movements.
It’s essential to consider these factors holistically rather than relying on a single indicator.
**Note:** Technical analysis is not foolproof and should be complemented with fundamental analysis and market sentiment evaluation. Always perform your due diligence before making trading decisions.