Comprehensive Technical Analysis for Celsius (CEL)
As of 17/01/2025 14:46:28
Executive Summary
Based on the latest technical indicators, the combined recommendation for Celsius (CEL) is:
Hold Off (Short-Term); Hold Off (Long-Term).
Short-Term View: Hold Off (Short-Term)
Long-Term View: Hold Off (Long-Term)
These suggestions are derived by analyzing multiple technical indicators over both short and long time horizons.
Based on the analysis, here is the following trade recommendation:
-
Consider buying at: $0.15 (7-day ATR, Buffer: 0.25) / $0.15 (30-day ATR, Buffer: 0.15)
– 7-day ATR Calculation: Buy Price = Support Level – (ATR x Buffer Factor (0.25)).
Example: Buy Price = 1.00 – (0.10 x 0.25) = 1.00 – 0.025 = 0.975
– 30-day ATR Calculation: Buy Price = Support Level – (ATR x Buffer Factor (0.15)).
Example: Buy Price = 1.00 – (0.15 x 0.15) = 1.00 – 0.0225 = 0.9775
-
Consider selling at: $0.23 (7-day ATR, Buffer: 0.25) / $0.23 (30-day ATR, Buffer: 0.15)
– 7-day ATR Calculation: Sell Price = Resistance Level + (ATR x Buffer Factor (0.25)).
Example: Sell Price = 1.50 + (0.10 x 0.2) = 1.50 + 0.025 = 1.525
– 30-day ATR Calculation: Sell Price = Resistance Level + (ATR x Buffer Factor (0.15)).
Example: Sell Price = 1.50 + (0.15 x 0.15) = 1.50 + 0.0225 = 1.5225
Technical Indicators Overview
1. Price Analysis
-
Latest Close Price: $0.1712576357
The most recent closing price of Celsius. This serves as a reference point for analyzing price movements.
-
Support Level (30 day): $0.1536285334
A price point where demand is strong enough to prevent further decline. Traders often look to buy at support levels, anticipating a price rebound.
- Resistance Level (30 day): $0.2262058671
A price point where selling pressure may halt an upward move. Traders may consider selling at resistance levels, expecting a price drop.
- Support Level (7 day): $0.1536285334
A price point where demand is strong enough to prevent further decline. Traders often look to buy at support levels, anticipating a price rebound.
- Resistance Level (7 day): $0.1756345296
A price point where selling pressure may halt an upward move. Traders may consider selling at resistance levels, expecting a price drop.
How to use: Identifying support and resistance helps set entry and exit points. Buy near support and sell near resistance for effective trading.
2. Relative Strength Index (RSI)
RSI measures the speed and change of price movements on a scale of 0 to 100.
RSI < 30: Oversold; RSI > 70: Overbought.
- RSI (7-period): 44.06
- RSI (30-period): 40.97
How to use: Use RSI to identify potential reversal points. Sell when overbought and buy when oversold.
3. Stochastic RSI
This oscillator applies the stochastic formula to RSI values, enhancing sensitivity to price changes.
- Overbought: Values above 80 may indicate overbought conditions.
- Oversold: Values below 20 may indicate oversold conditions.
- StochRSI %K (7-period): 95.91
- StochRSI %K (30-period): 36.27
How to use: Stochastic RSI provides more precise entry and exit signals, especially in volatile markets.
4. Moving Averages (SMA)
SMA calculates the average price over a specific period, smoothing out price data to identify trends. SMAs help identify trend directions.
- Short-term SMA: Reflects recent price movements.
- Long-term SMA: Indicates longer-term trends.
- SMA (7-period): 0.16887635612857177
- SMA (30-period): 0.18538414256666677
- Trend Analysis: Short-term trend is bearish (7-SMA < 30-SMA)
How to use: Compare short-term and long-term SMAs to identify trend directions. For example, if the short-term SMA crosses above the long-term SMA, it may signal a bullish trend.
5. Average True Range (ATR)
ATR measures market volatility by averaging the true range over a set period.
- High ATR: Indicates high volatility.
- Low ATR: Indicates low volatility.
- ATR (7-period): 0.010879632710997665
- ATR (30-period): 0.017728206281932293
How to use: ATR helps set stop-loss levels and assess risk. In volatile markets, widen stop-loss orders to avoid premature exits.
6. Moving Average Convergence Divergence (MACD)
MACD is a momentum indicator that shows the relationship between two moving averages.
- MACD Line: Difference between the 12-day and 26-day EMAs.
- Signal Line: 9-day EMA of the MACD line.
- Histogram: Difference between the MACD line and the Signal line.
- MACD (7-period): MACD: -0.011516771459055553, Signal: -0.012660722909373246
- MACD (30-period): MACD: -0.011516771459055553, Signal: -0.012660722909373246
How to use: Crossovers between the MACD and Signal line indicate buy or sell signals. A rising histogram suggests increasing momentum.
7. Average Directional Index (ADX)
ADX measures the strength of a trend on a scale of 0 to 100.
- Above 25: Indicates a strong trend.
- Below 20: Indicates a weak or non-existent trend.
ADX > 25: Strong trend. ADX < 25: Weak trend.
- ADX (7-period): ADX: 32.98, +DI: 11.29, -DI: 21.62
- ADX (30-period): ADX: 15.76, +DI: 18.60, -DI: 18.20
How to use: ADX helps determine whether the market is trending or ranging, guiding strategy selection.
8. Rate of Change (ROC)
ROC measures the percentage change in price over a specified period.
- Positive ROC: Indicates upward momentum.
- Negative ROC: Indicates downward momentum.
- ROC (7-period): -1.2657559495510844%
- ROC (30-period): -22.75126030807909%
How to use: Use ROC to identify the speed of price movements for momentum-based trading decisions.
9. Risk-Reward Ratio
This ratio compares potential profit to potential loss in a trade.
- High Ratio: Potential reward outweighs risk.
- Low Ratio: Potential risk outweighs reward.
- RR (7-period): 3.12
- RR (30-period): 3.12
How to use: Use this ratio to assess trade viability, aiming for higher rewards relative to risks.
10. Bullish Candlestick Patterns
Specific candlestick formations can indicate potential upward price movements.
- Examples: Engulfing patterns, Morning Star, Hammer.
- 7-period Patterns: No bullish patterns identified.
- 30-period Patterns: No bullish patterns identified.
How to use: Recognizing these patterns helps anticipate bullish reversals or continuations.
11. Volume Analysis
Volume reflects the number of shares or contracts traded in a security.
- High Volume: Confirms price movements.
- Low Volume: Suggests weak interest.
- Yesterday’s Volume: 898959.43
How to use: Volume analysis helps validate trends and potential reversals.
Price Charts
Visual representations of price movements over time:
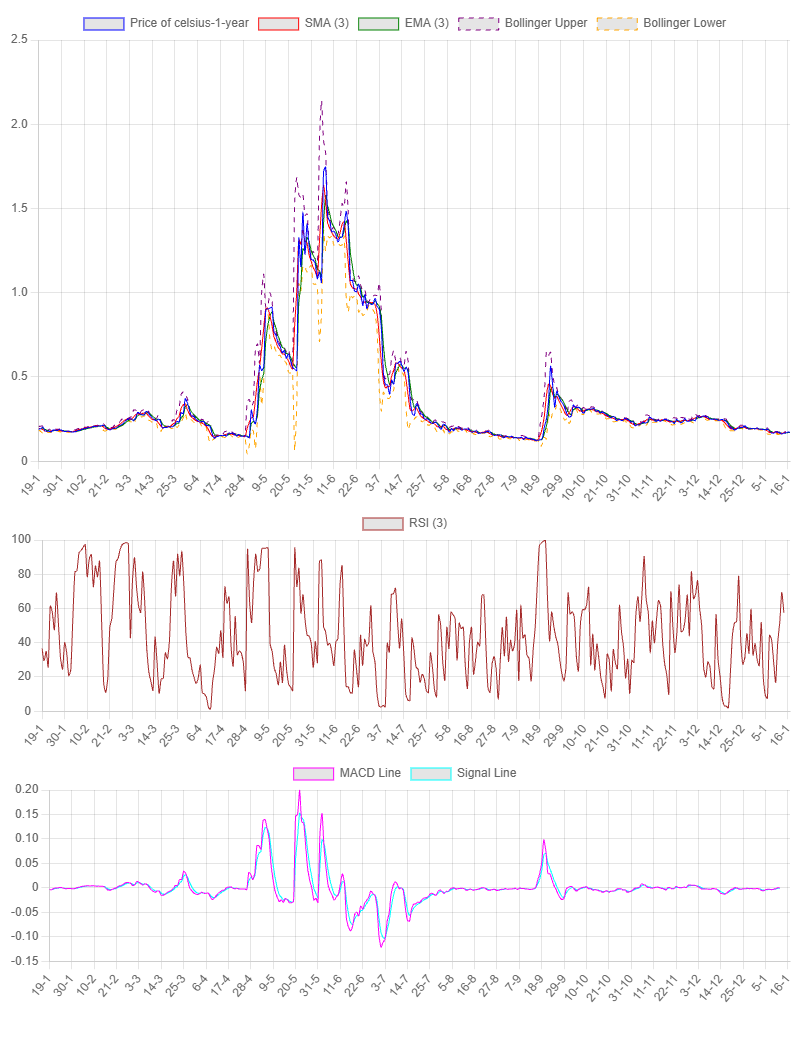
- 1-Year Chart: Shows long-term trends.
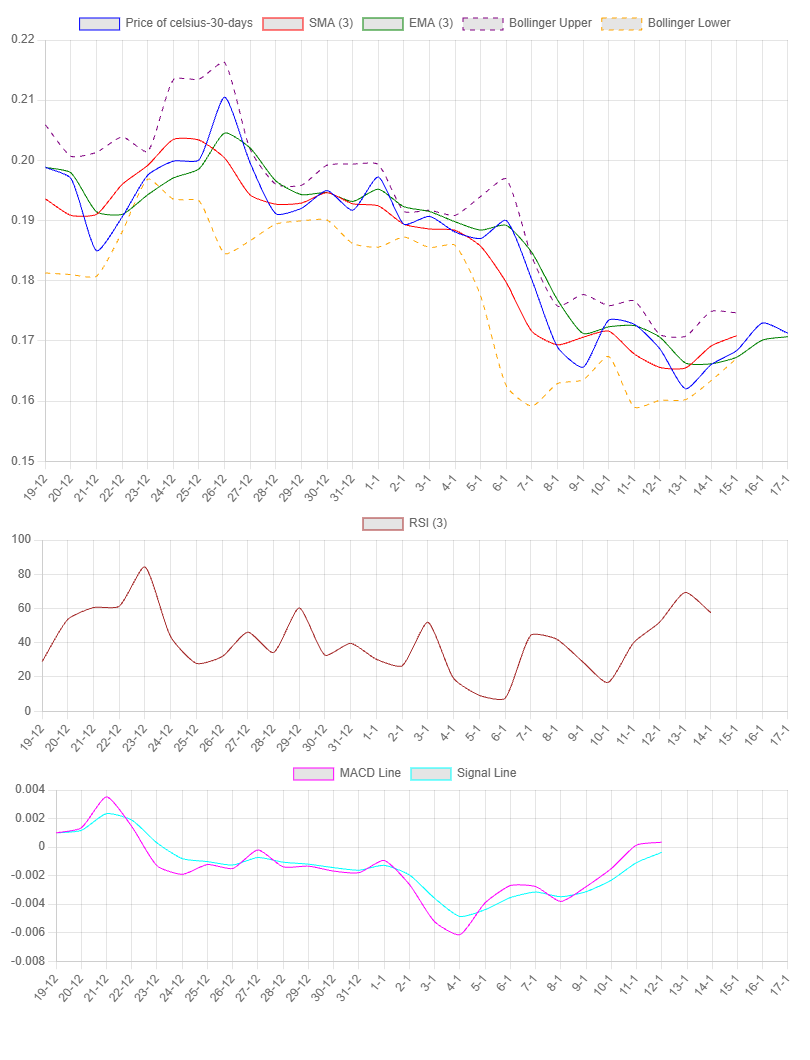
- 1-Month Chart: Highlights intermediate trends.
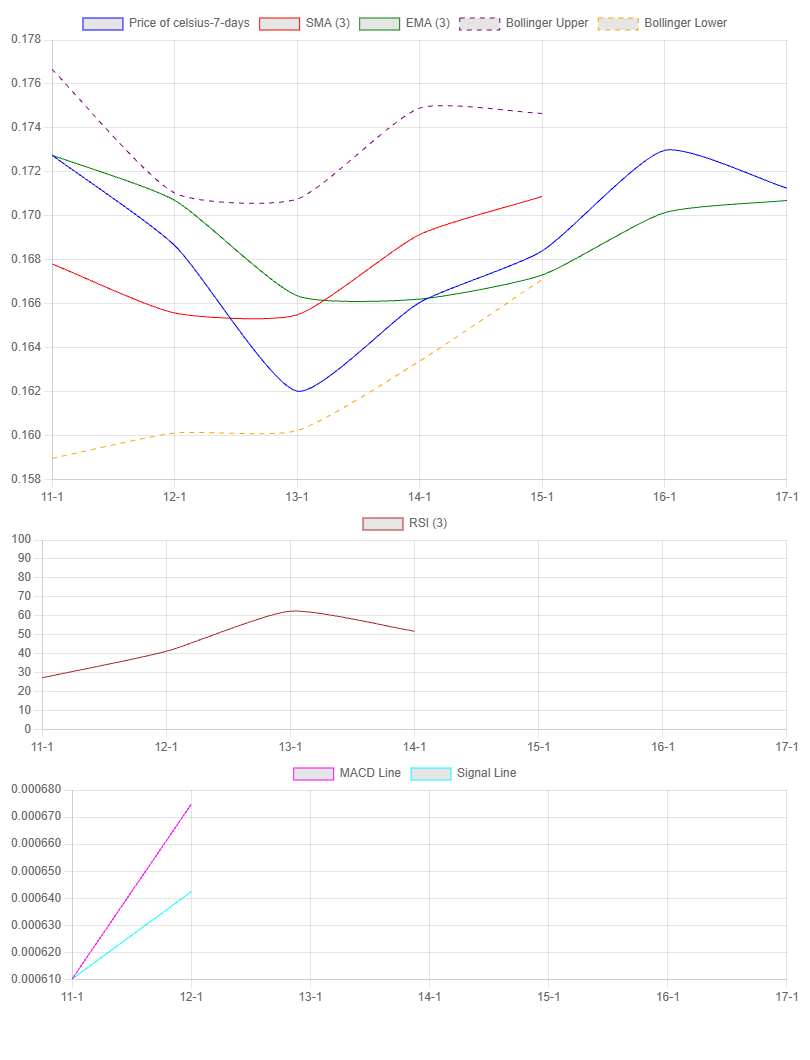
- 7-Day Chart: Focuses on short-term movements.
How to use: Use charts to identify patterns, trends, and potential entry or exit points.
Price Over the Last Year
Price Over the Last Month
Price Over the Last 7 Days
Volume
Chart data unavailable.
Fibonacci Prediction
Uses Fibonacci ratios to predict potential support and resistance levels.
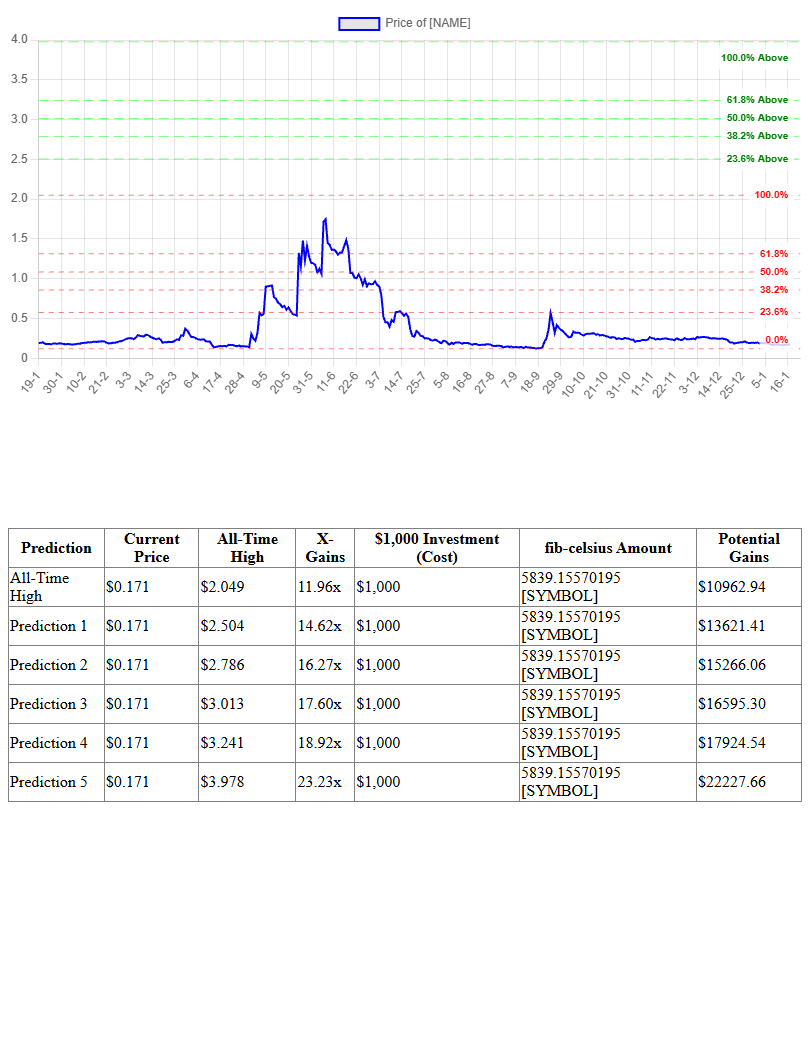
How to use: Traders use these levels to anticipate price retracements and extensions.
Detailed Indicator Analysis
Relative Strength Index (RSI)
Current RSI (7-period): 44.06, (30-period): 40.97.
Neutral conditions on short-term.
Stochastic RSI
StochRSI (7-period): 95.91, (30-period): 36.27.
Overbought (short-term).
Moving Averages (SMA)
SMA (7-period): 0.16887635612857177, SMA (30-period): 0.18538414256666677.
Short-term trend is bearish.
Average True Range (ATR)
ATR (7-period): 0.010879632710997665, (30-period): 0.017728206281932293.
Low volatility (short-term).
Moving Average Convergence Divergence (MACD)
- 7-period: MACD: -0.011516771459055553, Signal: -0.012660722909373246
- 30-period: MACD: -0.011516771459055553, Signal: -0.012660722909373246
Short-term bullish momentum.
Average Directional Index (ADX)
ADX (7-period): 32.98, (30-period): 15.76.
Strong trend (short-term).
Rate of Change (ROC)
ROC (7-period): -1.2657559495510844%, (30-period): -22.75126030807909%.
Negative momentum (short-term).
Risk-Reward Ratio
RR (7-period): 3.12, (30-period): 3.12.
Favorable (short-term).
Bullish Candlestick Patterns
7-period: No bullish patterns identified.
30-period: No bullish patterns identified.
Volume Analysis
Yesterday’s Volume: 898959.43.
Indicates market interest.
Final Recommendation
Combined Recommendation: Hold Off (Short-Term); Hold Off (Long-Term)
Consider integrating fundamental analysis and market sentiment alongside these technical indicators
before making any trading decisions. This analysis combines multiple indicators to offer a more holistic view:
- RSI & StochRSI for overbought/oversold conditions
- MACD for momentum shifts
- ADX for trend strength
- ROC for momentum direction
- Risk-Reward ratio for potential profitability
- Volume for market participation
**Note:** No analysis is foolproof. Use this as a guide, not a guarantee.